Gas market overview Q2 2023
Volatility returns in the end of Q2
- Prices touch lowest levels since the summer of 2021
- LNG imports make new all-time highs, but Norway’s production takes a hit
- Storage levels remain elevated, preventing a repeat of last summer’s panicky market
- Volatility returns as some of the risks materialize
Prices touch lowest levels since the summer of 2021
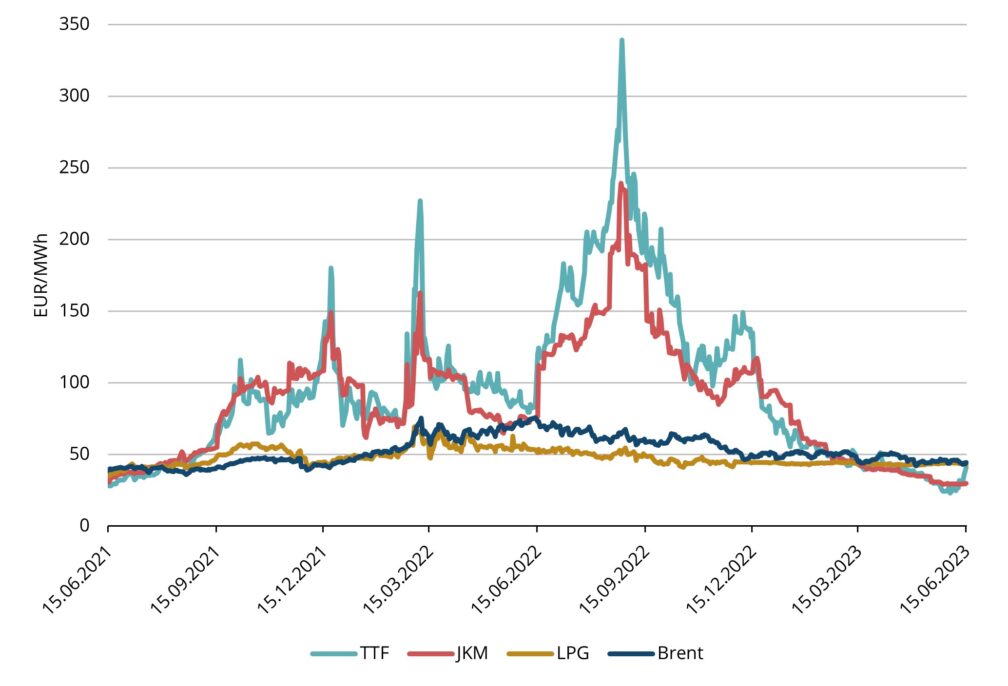
The average European natural gas benchmark TTF price was 39.58 EUR/MWh for Q2 2023 deliveries. During the quarter, prices continued to decline steadily before front-month prices bounced back in June. TTF front month futures bottomed in the beginning of June at 22.86 EUR/MWh which was the lowest price since May 2021. As of 19th of June, the July Full Month 2023 TTF price index is at 32.29 EUR/MWh, which would be the lowest settlement since the summer of 2021 (see fig. 1). The TTF forward price for the nearest full month Aug 2023 traded at 35.37 EUR/MWh on 19th of June. During Q2, natural gas prices kept falling due to the same key factors as previous quarters – LNG imports remained strong on the supply side while demand remained substantially below historical levels.
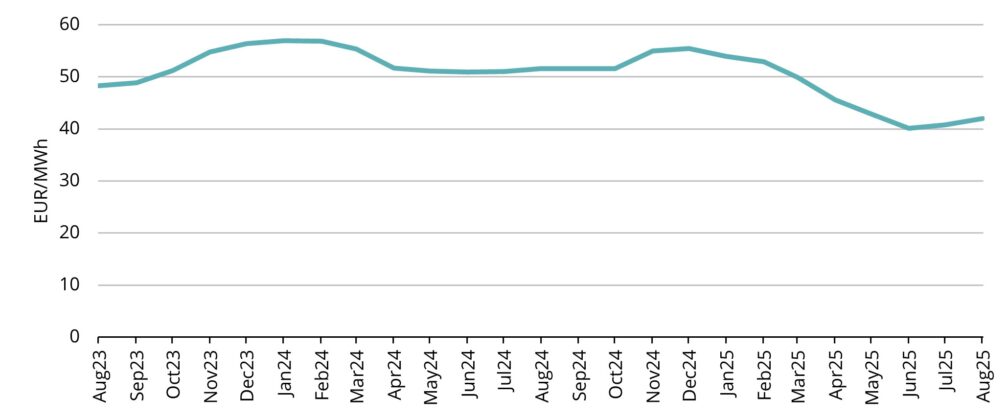
On the forward curve, prices are still in sharp contango, meaning each future month is priced slightly higher than the preceding month, up to January 2024 where the forward price levels are at around 55 EUR/MWh. It can also be seen that the futures are being traded over 50 EUR/MWh for all of 2024 period (see fig. 2).
LNG imports make new all-time highs, but Norway’s production takes a hit
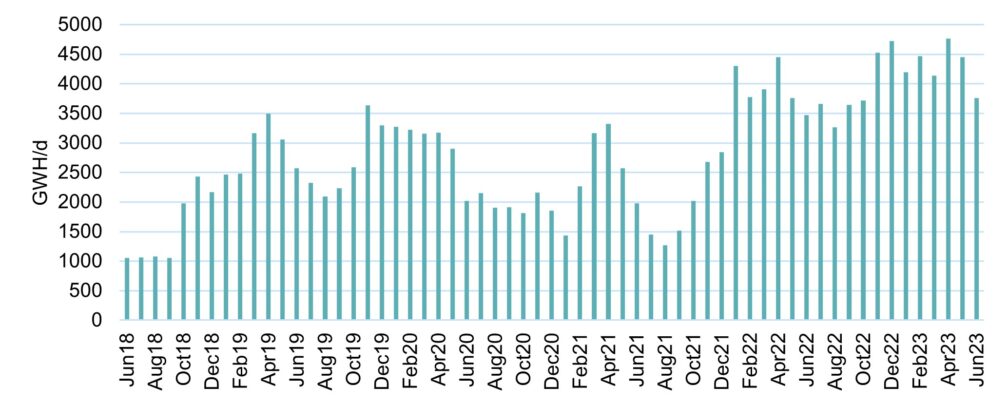
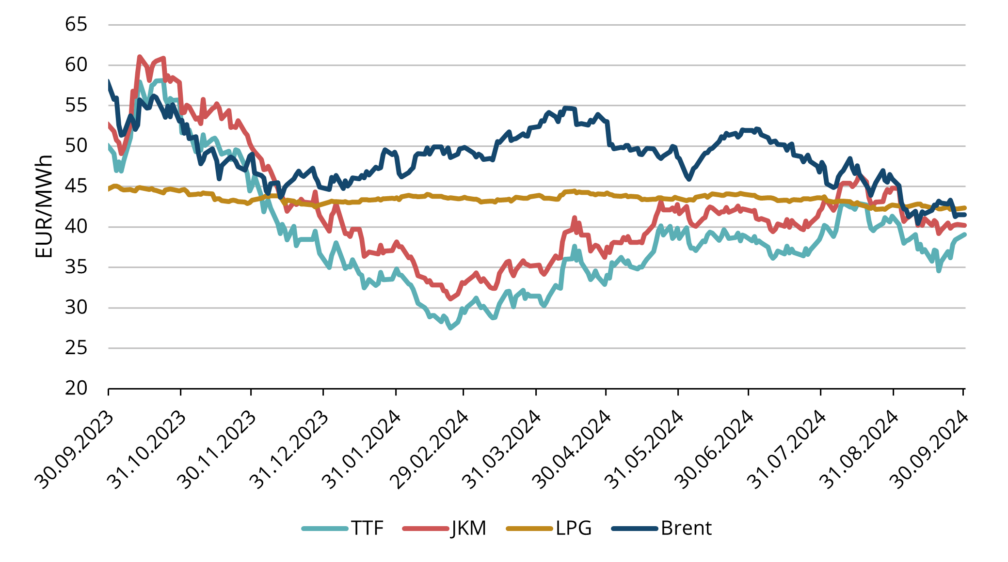
Figure 3. LNG import to key European terminals (UK, NL, Germany, Belgium, France, Italy, Iberia), Refinitiv
LNG imports into Europe remained robust throughout Q2 as a record volume of LNG flowed into key European terminals (see fig. 3). As a key development in our region, the Finnish Inkoo terminal started first commercial operations, with six cargoes being imported by Elenger during Q2 to the terminal.
However, as highlighted in our last quarter’s market update, one of the key risks during this summer is Norway’s high maintenance schedule. We have already seen this risk materialize to some degree as June saw volatility rise due to multiple issues regarding Norway’s production. Firstly, production in Hammerfest LNG production had to be stopped due to a leak in the cooling circuit, and the full restart took two weeks. Furthermore, in mid-June, three important gas fields – Ormen Lange, Nyhamna, Aasta Hansteen – also experienced different issues and the maintenance works had to be extended. This resulted in significantly lower Norway export numbers (see fig.4).
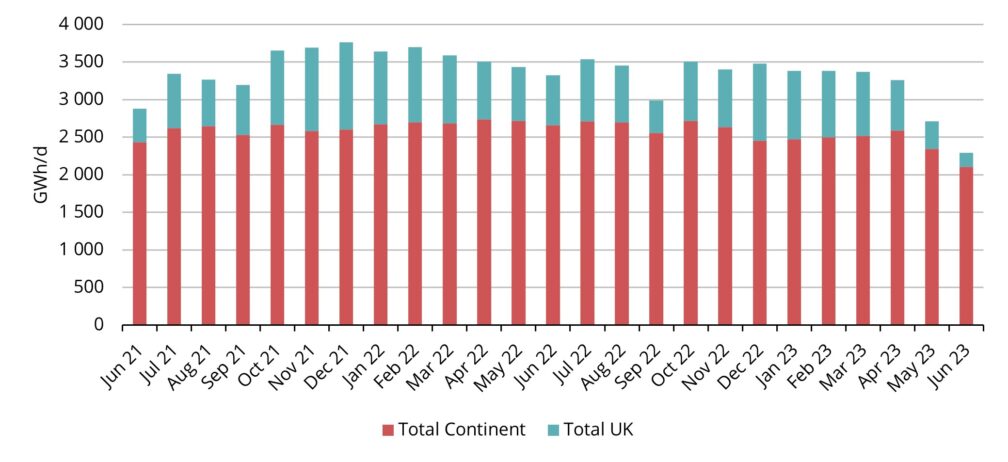
Figure 4. LNG import to key European terminals (UK, NL, Germany, Belgium, France, Italy, Iberia), Refinitiv
Additionally, Dutch government announced that they will close the Groningen plant latest in 2024. All these factors combined caused significant price spikes on multiple days during June.
Storage levels remain elevated, preventing a repeat of last summer’s panicky market
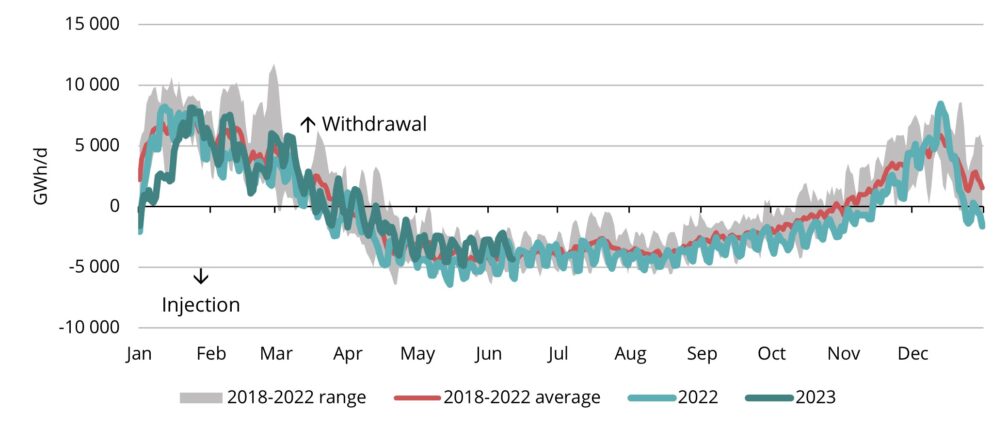
Northwest European inventory levels are more than 70% full as of middle of June (Refinitiv), which is significantly higher than historical average (see fig.6). Factors on both the supply and demand side have contributed. Supply has remained very strong as LNG imports have been on record levels throughout the 2023 (see fig.4). At the same time on demand side NW European gas consumption has dropped by 17% compared to last year which is more than forecasted (Goldman Sachs). The decline in gas demand can primarily be attributed to lower industrial consumption, coupled with above-average temperatures throughout 2023, which have kept heating demand below initial forecasts. These factors enabled NW storages to move from withdrawal to injection mode already in March, leaving more time to fill the storages (see fig. 5).
Volatility returns as some of the risks materialize
As LNG inflows remained robust and demand side rather muted, we saw continued decline in prices throughout April and May. However, in June the front month futures price spiked from under 23 EUR/MWh to nearly 50 EUR/MWh, only to settle back around 35 EUR/MWh levels. Gas price volatility hit highest level since September 2022 (Argus Media). This illustrates the market’s sensitivity to any surprises and vulnerability of the market balance.
The primary catalysts for such volatility were the challenges related to Norway’s exports, as detailed in the second chapter. Throughout the summer months, Norwegian maintenance schedule remains critical price driver as any further unexpected developments could cause more volatility.
While LNG inflows have displayed remarkable strength, it is worth noting that Europe’s TTF prices have dipped below Asia’s JKM index (see fig. 1). Consequently, some of the spot cargoes have redirected from Europe to Asia, as sellers capitalize on enhanced value in those markets. Hence, the demand landscape in Asia, particularly in China, remains a key determinant going forward, potentially putting pressure on European prices by attracting more LNG cargoes to Asia. However, contrary to the anticipation held by many participants over the past few quarters, Asia’s demand has yet to witness a substantial increase. As always, weather is one of the key drivers on the demand side and if the summer months would see strong heatwaves across Europe then the demand for cooling systems could add additional pressure on gas prices, as was already seen in June when the above average temperatures arrived to Europe.
The price surge experienced in June can largely be attributed to short-term factors. Moving forward into the summer months, the potential for significant price increases appears rather limited because as previously noted, storage levels are historically high and this should restrain summertime demand. However, given that the recent spike took place while there were no real changes in longer-term fundamentals, it is a clear sign of quite heavy short positioning in the market, leaving it exposed to another price rally in case of further unforeseen events. There are still notable risks, as previously highlighted: Norway’s intensive maintenance schedule and the prospect of heatwaves sweeping across Europe are short-term factors, while lingering uncertainties persist concerning Asia’s demand which could have longer-term impact on prices.
This market overview is for informational purposes only. We aim to compile the most relevant data from various sources in good faith but the analysis should not be treated as an advice or taken as the sole basis for any action.
